 For this edition the engineer Cortés brings the second part of an interesting article that seeks to shed light on the calculation of the bandwidth (BW, for its acronym in English: Band Width) of a communications channel to transmit video.
By Germán Alexis Cortés H.
In this second installment, the engineer Cortés begins by expanding the concept of Percentage of Activity of the Scene. This is a factor that very few manufacturers include within their formulas and calculators, initially because it is a bit tangled to determine, but with shame I must say that some omit it, simply to increase their sales at the level of bandwidths or hard disk capacity. Let's look at the following operation:
To multiply by a % it is necessary to pass this number to decimal notation, that is, to divide the number of the percentage found by a hundred. In this way, a percentage of 80%, becomes 0.8 or 23% 0.23. So 100% is a simple 1.
If we look at the aforementioned formula, multiplying by 1 (100% of activity) gives us the same result, but multiplying by a percentage of activity less than 100% means multiplying by a number less than one, which automatically gives us a lower result of bandwidth, and this is very good, because we save bandwidth, then it is highly advisable to take into account the percentage of activity of the scene.
Scene Activity: It is a parameter expressed in a Percentage (%) that determines how much the images change from one frame to another, and how much movement actually exists in the scene.
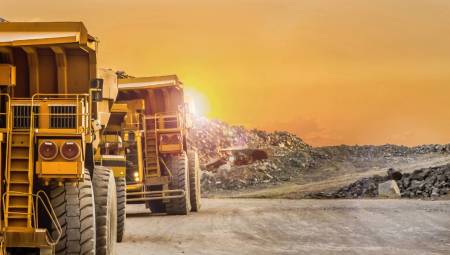
For example if we had a camera observing a large highway, we could say that it is very likely that the activity is very high (almost 100%), that is, there is always movement in the scene, however if the camera sees vehicle lanes and some buildings behind, we can say that not everything moves, for example the houses or buildings in the back of the scene do not move, rather they remain fixed or with minimal changes, the percentage of scene activity is lower, to a camera that is only seeing the lanes of vehicles.
Similarly they do not have the same activity of movement the camera looking at the corridor of a quiet office of five employees to a camera observing a checkout in a large supermarket.
This activity affects two things:
to. The ability of video compression algorithms (loosy-interframe), such as MPEG. A lot of activity damages the predictions that are made internally and gets more type I blocks to be used than P or B (this is compression algorithm theory), which definitely increase the bandwidth.
b. The actual number of images I actually want to transmit to view or store. In this case I am referring to the fact that obviously if there are no image changes in the scene I really do not have to transmit another frame with the same image, I can save it, both to visualize and to record.
So getting to know what the percentage of activity of a scene is is a primary factor to take into account.
How is that determined?
Very easy, it is something wasteful but with practice it can be done in a simple and professional way, the first thing I recommend is NOT to invent the percentage. Humans are very given to throwing numbers into the air, without having the necessary premises to calculate.
I recommend you attend the site where you are going to perform the calculation at three different times, in hours of high, medium and low traffic. This is known very well to the end user and therefore you have to ask him.
For example, at the reception of a building, there is a lot of traffic between 7:30 a.m. and 8:30 a.m. when 98% of the employees arrive to work. The same happens between 12:00 m. and 2:00 p.m. when they leave and enter for lunch and finally between 5:30 p.m. and 6:30 p.m. when they leave for their homes.
In the rest of the hours the traffic is scarce, caused by correspondence activities and sporadic visits of people. Finally between 8:00 p.m. and 7:00 a.m. the next day the presence of humans or activity is almost nil, interrupted only by the vigilant tourer and the cleaning staff. As we see we have a very normal and routine activity, so what is the percentage of activity of a camera located on this site?
To find the value it is necessary to do it by time windows, for example: high traffic: 4 hours a day; Average traffic: 8.5 hours a day and low traffic: 11.5 hours a day.
I must go to the site with a stopwatch and a clock in hand to measure in the different time windows determined. This far from spending a full day, we can do it in just two hours. For example, attending this office at 7:00 a.m., where we can measure the activity in hours of low traffic, then we measure in hours of high traffic and end up taking some measures in hours of average traffic around 9:00 a.m., in total two hours of investigation.
I start for example to take the measurement at 7:10 a.m. and I will take the measurement for three minutes, that is, until 7:13 a.m. I am located in the approximate place where the camera is going to be installed directing my gaze towards the scene that approximately the lens calculated for that camera would let me see.
Stretching my arms to form an angle that helps me define the ends of the simulated image helps a lot. I act as a camera and a digital image change detector, and then I start the stopwatch when in the field of view simulated by my arms I detect image changes due to the presence of a person or object. I stop it when that movement is over.
I go back and turn it on when the next move comes and turn it off when it's finished, and so on until the watch arrives at 7:13 a.m. Suppose that the stopwatch after these three minutes of sampling was in nine seconds.
Then I convert everything to the same units (in this case seconds), and apply a rule of three: If three minutes of time, that is, 180 seconds, means 100% of my sample, then nine seconds of activity, to what percentage corresponds?
The formula is 9 x 100 / 180 = 5% activity. This is the average activity in the low-traffic time window.
Exactly the same must be done during three-minute samples at 8 a.m. for high traffic and another at 9 a.m. for medium traffic.
Suppose that in high traffic the chronometer marked activity of 169 seconds, which represents 169 x 100 / 180 = 94% and in medium traffic the chronometer reached 55 seconds, which represents 55 x 100 / 100 = 31%
So now we can have the parameter to measure the bandwidth for three different time windows (This is how it should be done and calculated in a detailed and professional way), however to make it more general, we can make a weighted average of all the time windows for this camera, in this way: ( (5% x 11.5 hours) + (94% x 4 hours) + (31% x 8.5 hours) ) / 24 hours = 29% weighted average activity for this camera.
If you found it difficult and complicated I recommend that you review your high school grade notes when you were taught the three-way rules and weighted averages.
Truth, common sense prevails and the calculations are very simple. But I must admit that it is wasteful and boring the way we determine the percentage of activity.
In the CCTV courses that I do at the Latin American level, with WINGS, when we do this exercise, there are always people who launch themselves without having done the calculations to give a percentage of activity, they always talk to me about 50% or 80%, but really it was only 29%. This is involved in buying a much larger hard drive or requesting a transmission channel with better bandwidth, when suddenly it is not needed.
Costs drop noticeably when you make a serious, professional and detailed calculation. You are also filled with arguments to justify the proposed solution, which in many cases your competition will never do, simply because you are lazy or do not know how to do it.
Finally I must multiply by eight, to finish the formula, simply because the average sizes of each frame are delivered in Bytes and the bandwidth must be delivered in bits.
Final example
So now YES, with all the parameters seen, explained and found, we can find the BW of any camera.
For example, let's assume that we have a fixed minidome camera with IP output, in an office with modular open-type furniture, observing the employees. They work from 8:00 a.m. to 6:00 p.m. on a continuous day.
From 6:00 p.m. to 8:00 a.m. the next day it closes and no one is left working. In the activity measurements we found that during the day the average activity was 78% and at night the average activity is 6% (please note that it is not zero). We will remotely broadcast at 15 FPS during the day and at 30 FPS only during the events that are presented at night. The camera has 480 TVL resolution and by the network port, they deliver us in D1 resolution a stream of compressed video using an MPEG4-L2 algorithm, the manufacturer informs us that on average each frame consumes 8KB.
At night the resolution that is sent is much higher, each frame consumes 24KB. What will be the bandwidth needed during the day and what will be at night?
Solution
All we have to do is apply the vista formula, however we already realize that we must do the exercise twice, once for the day and once for the night. The bandwidth of the channel we request will depend on the greater between the two results it gives us.
Then for the day: BW = 15 FPS x 8KB x 78% x 8 = 15 x 8 x 1024 x 0.78 x 8 = 749 Kbps
For the evening: BW = 30 FPS x 24KB x 6% x 8 = 30 x 24 x 1024 x 0.06 x 8 = 345 Kbps
Therefore choosing the most critical point, the one with the highest value, we require for our transmission channel a bandwidth of at least 749 Effective Kbps, which when passed to nominal gives us: 749 / 40% = 1873 Kbps, that is, 1.83 Mbps. Then I contract an Internet access channel of at least 2 Mbps for just this camera.
Sloth solution
What if we had assumed an activity percentage of 100% in the day and 0% at night, as anyone (even yourself) might have thought? In the day, 983 Kbps and at night 0. So we have two wrong scenarios:
to. Many people would have been content with a 1 Mbps channel for the day, which we really know would NOT serve them.
b. When doing the calculation of cash to nominal they would have needed a channel of 2.4 Mbps, that is, a commercial link of 3 or 4 Mbps, which is surely much more expensive than the really necessary.
Professionals do not know about laziness nor do we invent solutions. We analyze, investigate, calculate, justify and support our solutions with solid arguments.
Multiple cameras
These calculations must be made for each camera and in the time windows that are necessary. As there are many I recommend that you do them in Excel, in a sheet that you put together so that you understand it perfectly and in an organized way you can change any parameter, modifying the final result.
When many cameras must be received at a remote point, the effective bandwidth (BW) must be added and in the end passed to nominal, which is how the communications market works.
However, to save even more bandwidth the question to ask is not how many cameras report to this point, but how many cameras I want to see simultaneously at this point. The sum of the bandwidths of these cameras (not necessarily all of them) is the BW that is required at this central monitoring site. (If recording is required If the BWs of all cameras should be taken into account).
As a final tip increase to this value by 20% for future expansions, which are very common in the subject of CCTV.
In a next edition we will take the result found here and use it to calculate the necessary hard drive.
* Germán Alexis Cortés H. is a Colombian Electronic Engineer, with a postgraduate degree in Engineering Management Systems. Consultant of the National Institute of Standards and Technology – NIST, in Electronic Security and Building Automation. CCP of ASIS, and CISSP of ISC2. He has over 20 years of experience in the electronic security industry. Renowned lecturer and university professor on high-tech issues at the Latino level. He has been a director of several companies in the sector and is currently a partner and directs Insetrón Ltda, an engineering and technical consulting company in electronic network projects for security, communications and automation. He has successfully participated in more than 150 projects at the Latino level.